Load the R package we will use.
Replace all the instances of ???. These are answers on your moodle quiz.
Run all the individual code chunks to make sure the answers in this file correspond with your quiz answers
After you check all your code chunks run then you can knit it. It won’t knit until the ??? are replaced
Save a plot to be your preview plot
Look at the variable definitions in
congress_age
What is the average age of members that have served in congress?
Set random seed generator to 123
Take a sample of 100 from the dataset
congress_ageand assign it tocongress_age_100
set.seed(123)

congress_age_100 <- congress_age %>%
  rep_sample_n(size=100)
congress_age_100
# A tibble: 100 × 14
# Groups:   replicate [1]
   replicate congress chamber bioguide firstname middlename lastname
       <int>    <int> <chr>   <chr>    <chr>     <chr>      <chr>
 1         1       85 house   F000209  Daniel    John       Flood
 2         1       83 house   R000187  George    Milton     Rhodes
 3         1       86 house   C001011  Laurence  <NA>       Curtis
 4         1      101 house   M000842  Guy       Victor     Molinari
 5         1       88 house   G000504  James     Russell    Grover
 6         1       92 house   A000189  Glenn     Malcolm    Anderson
 7         1      109 house   M000388  James     O.         McCrery
 8         1       84 senate  G000267  Barry     Morris     Goldwater
 9         1      102 senate  N000102  Don       <NA>       Nickles
10         1       96 house   H000074  Tony      P.         Hall
# … with 90 more rows, and 7 more variables: suffix <chr>,
#   birthday <date>, state <chr>, party <chr>, incumbent <lgl>,
#   termstart <date>, age <dbl>
congress_age
# A tibble: 18,635 × 13
   congress chamber bioguide firstname middlename lastname  suffix
      <int> <chr>   <chr>    <chr>     <chr>      <chr>     <chr>
 1       80 house   M000112  Joseph    Jefferson  Mansfield <NA>
 2       80 house   D000448  Robert    Lee        Doughton  <NA>
 3       80 house   S000001  Adolph    Joachim    Sabath    <NA>
 4       80 house   E000023  Charles   Aubrey     Eaton     <NA>
 5       80 house   L000296  William   <NA>       Lewis     <NA>
 6       80 house   G000017  James     A.         Gallagher <NA>
 7       80 house   W000265  Richard   Joseph     Welch     <NA>
 8       80 house   B000565  Sol       <NA>       Bloom     <NA>
 9       80 house   H000943  Merlin    <NA>       Hull      <NA>
10       80 house   G000169  Charles   Laceille   Gifford   <NA>
# … with 18,625 more rows, and 6 more variables: birthday <date>,
#   state <chr>, party <chr>, incumbent <lgl>, termstart <date>,
# age <dbl>congress_ageis the population and congress_age_100 is the sample18,635 is number of observations in the the population and 100 is the number of observations in your sample
Construct the confidence interval
- Use
specifyto indicate the variable fromcongress_age_100that you are interested in
Response: age (numeric)
# A tibble: 100 × 1
     age
   <dbl>
 1  53.1
 2  54.9
 3  65.3
 4  60.1
 5  43.8
 6  57.9
 7  55.3
 8  46
 9  42.1
10  37
# … with 90 more rowsgenerate1000 replicates of your sample of 100
Response: age (numeric)
# A tibble: 100,000 × 2
# Groups:   replicate [1,000]
   replicate   age
       <int> <dbl>
 1         1  42.1
 2         1  71.2
 3         1  45.6
 4         1  39.6
 5         1  56.8
 6         1  71.6
 7         1  60.5
 8         1  56.4
 9         1  43.3
10         1  53.1
# … with 99,990 more rows
The output has 100,000 rows
calculatethe mean for each replicate
Assign to
bootstrap_distribution_mean_ageDisplay
bootstrap_distribution_mean_age
bootstrap_distribution_mean_age  <- congress_age_100  %>%
  specify(response = age)  %>%
  generate(reps = 1000, type = "bootstrap")  %>%
  calculate(stat = "mean")

bootstrap_distribution_mean_age
Response: age (numeric)
# A tibble: 1,000 × 2
   replicate  stat
       <int> <dbl>
 1         1  53.6
 2         2  53.2
 3         3  52.8
 4         4  51.5
 5         5  53.0
 6         6  54.2
 7         7  52.0
 8         8  52.8
 9         9  53.8
10        10  52.4
# … with 990 more rows- The
bootstrap_distribution_mean_agehas 1000 means
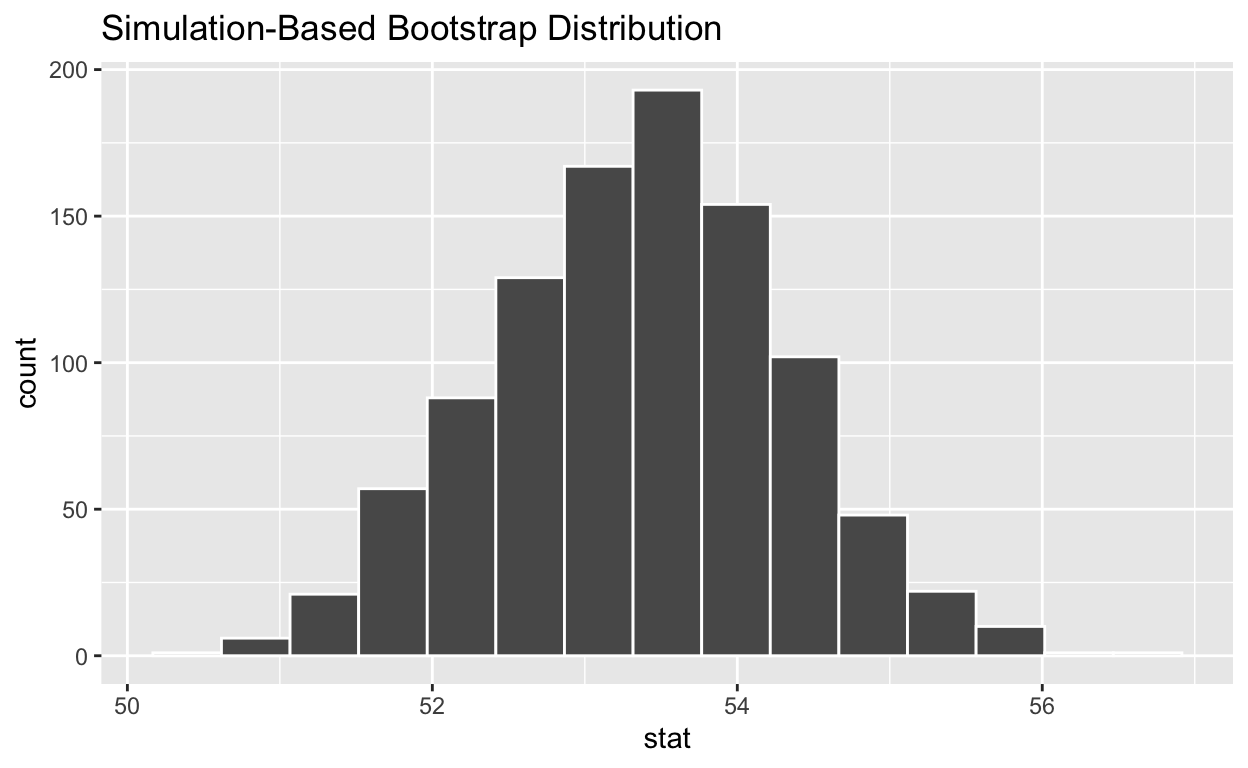
visualizethe bootstrap distribution
visualize(bootstrap_distribution_mean_age)
Calculate the 95% confidence interval using the percentile method
Assign the output to
congress_ci_percentileDisplay
congress_ci_percentile
congress_ci_percentile  <- bootstrap_distribution_mean_age %>%
  get_confidence_interval(type = "percentile", level = 0.95)

congress_ci_percentile
# A tibble: 1 × 2
lower_ci upper_ci
<dbl> <dbl>
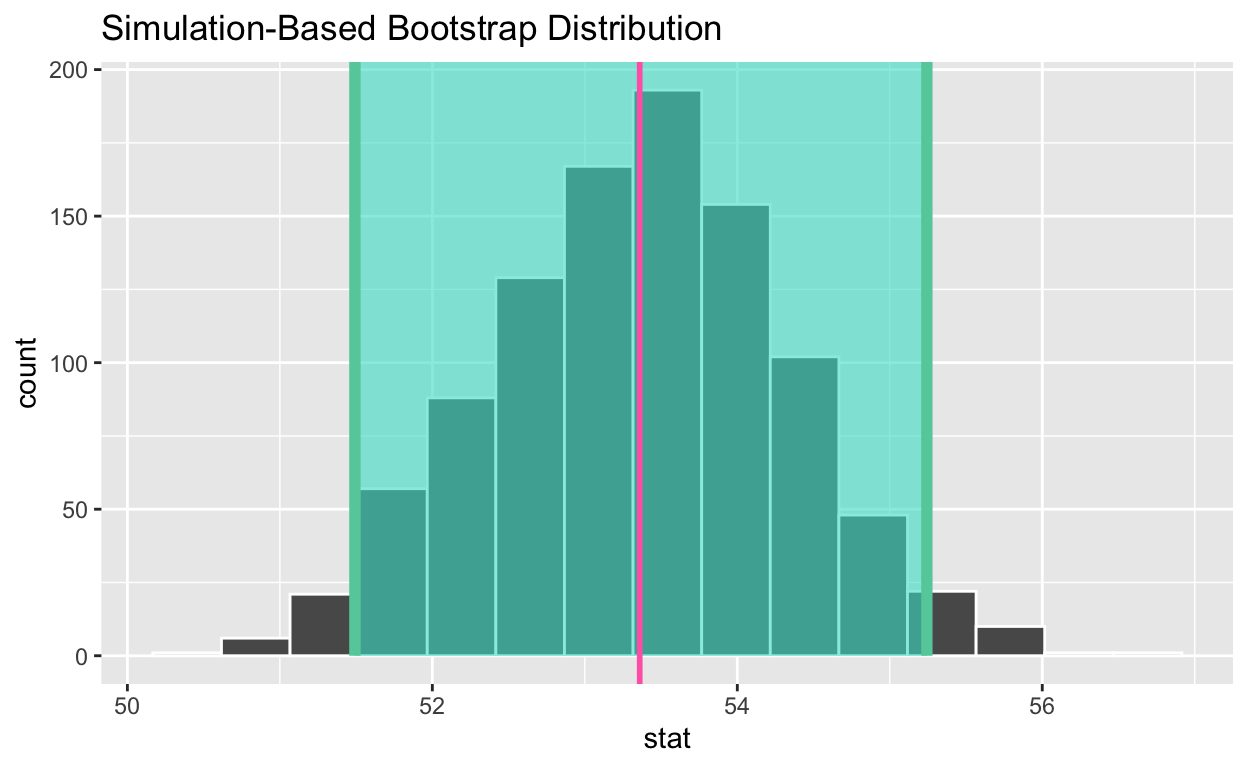
1 51.5 55.2Calculate the observed point estimate of the mean and assign it to
obs_mean_ageDisplay
obs_mean_age,
obs_mean_age  <-  congress_age_100  %>%
  specify(response = age)  %>%
  calculate(stat = "mean")  %>%
  pull()

obs_mean_age
[1] 53.36Shade the confidence interval
Add a line at the observed mean,
obs_mean_age, to your visualization and color it “hotpink”
visualize(bootstrap_distribution_mean_age) +
  shade_confidence_interval(endpoints = congress_ci_percentile) +
  geom_vline(xintercept = obs_mean_age, color = "hotpink", size = 1 )
Calculate the population mean to see if it is in the 95% confidence interval
Assign the output to
pop_mean_ageDisplay
pop_mean_age
[1] 53.31373- Add a line to the visualization at the, population mean,
pop_mean_age, to the plot color it “purple”
visualize(bootstrap_distribution_mean_age) +
  shade_confidence_interval(endpoints = congress_ci_percentile) +
   geom_vline(xintercept = obs_mean_age, color = "hotpink", size = 1) +
   geom_vline(xintercept = pop_mean_age , color = "purple", size = 3)
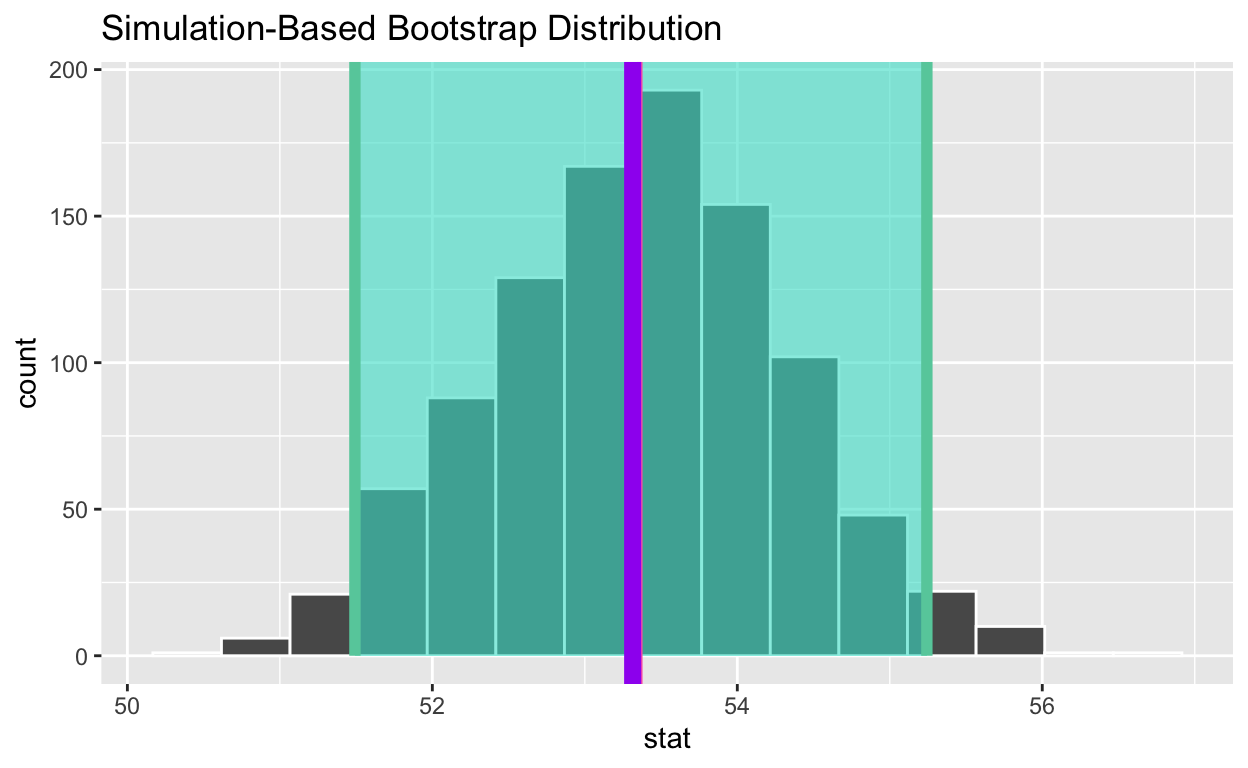
- Is population mean the 95% confidence interval constructed using the bootstrap distribution? yes
Change set.seed(123) to set.seed(4346). Rerun all the code.
When you change the seed is the population mean in the 95% confidence interval constructed using the bootstrap distribution? no
If you construct 100 95% confidence intervals approximately how many do you expect will contain the population mean? 95