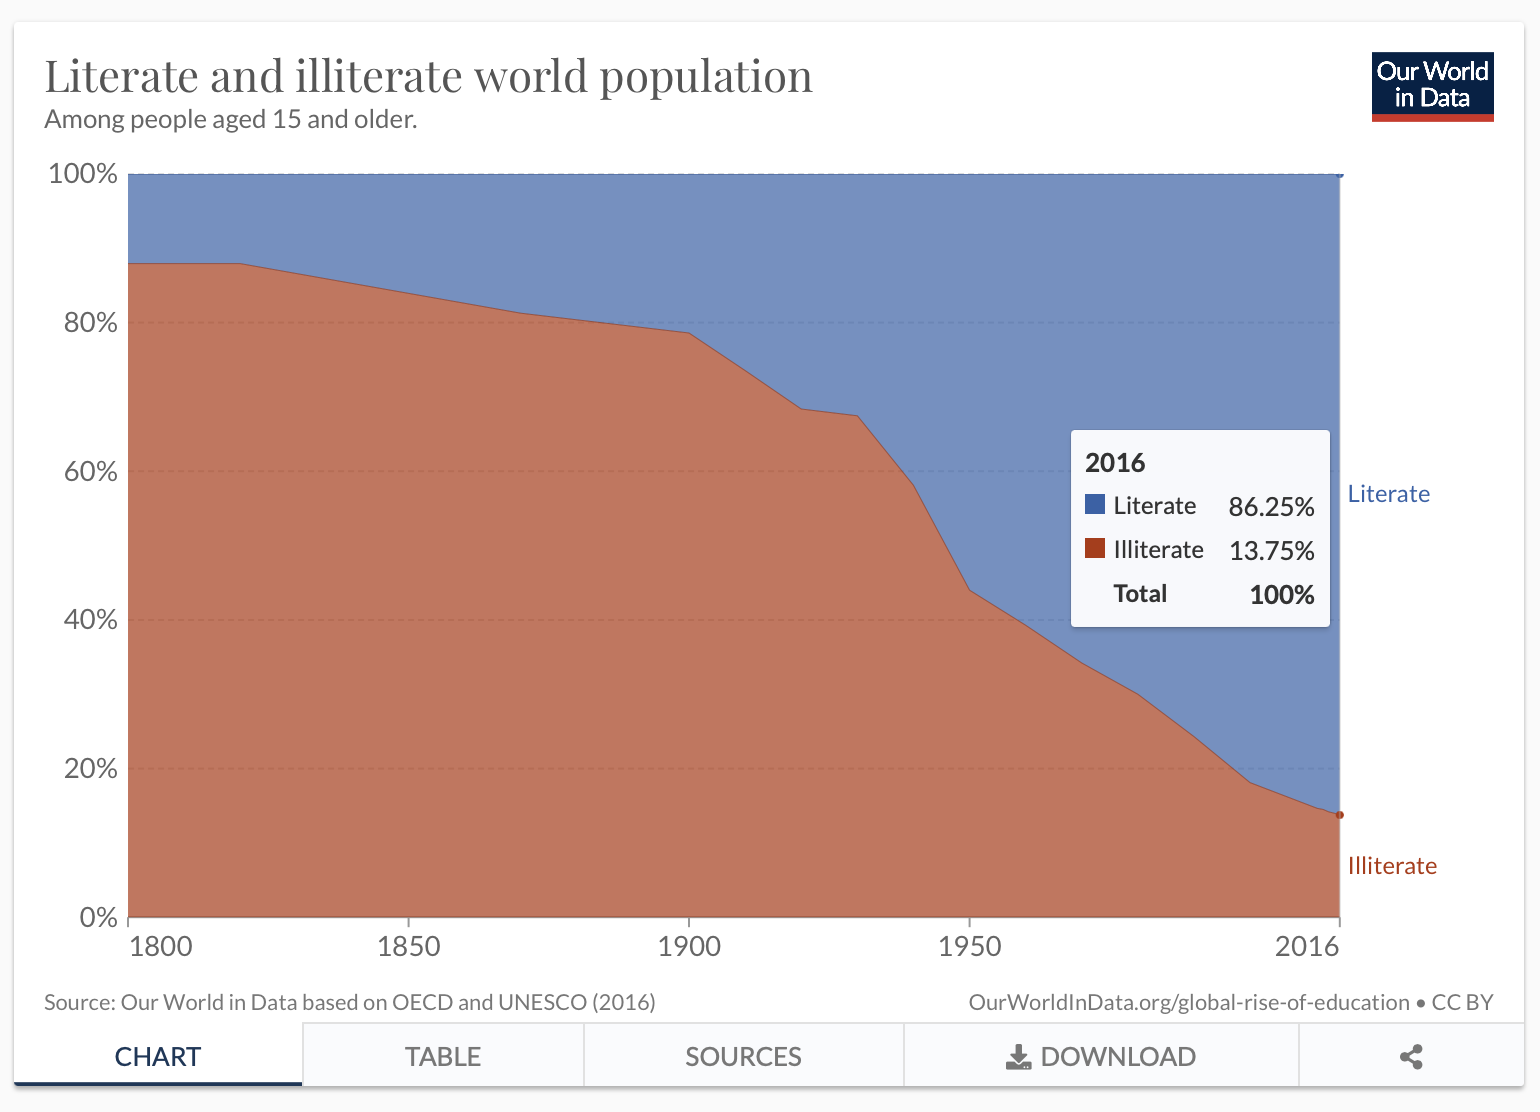
I downloaded literate and illiterate world population data from Our World in Data. I selected this data because I’m interested in learning more about the statistics surrounding the number of young children in school as well as not in school, along with how many children are literate globally.
This is the link to the data.
The following code chunk loads the package I will use to read in and prepare the data for analysis.
- Read the data in
- Use glimpse to see the names and types of the columns
glimpse(literate_illiterate_world_population)
Rows: 21
Columns: 5
$ Entity                                                             <chr> …
$ Code                                                               <chr> …
$ Year                                                               <dbl> …
$ `Literate world population (OWID based on OECD & UNESCO (2019))`   <dbl> …
$ `Illiterate world population (OWID based on OECD & UNESCO (2019))` <dbl> …
#view (literate_and_illiterate_world_population)
- Use output from glimpse (and view) to prepare the data for analysis
Change the name on the 4th column to Literature and the 5th column to Illiterate
Use filter to display rows: Year >= 1930
- Select the columns to analyze: Year, Literature, Illiterate
- Assign the output to literature_and_illiterate
Check the total for 2016 equals the total in the graph
# A tibble: 1 × 3
   Year Literate Illiterate
  <dbl>    <dbl>      <dbl>
1  2016     86.2       13.8
Add a picture
Write the data to file in the project directory
write_csv(literate_and_illiterate, file= "literate_and_illiterate.csv")